Pipeline Explorer
Click a step
Generate
Ingest
Model
Validate
THE DATA FROM THIS PROJECT WAS GENERATED USING PYTHON TO NOT USE REAL CUSTOMER DATA
import pandas as pd
import numpy as np
from datetime import datetime, timedelta
import random
# -------------------------
# SETTINGS
# -------------------------
N_ENCOUNTERS = 100_000
N_APPOINTMENTS = 80_000
N_CLAIMS = 100_000
OUTPUT_FOLDER = "./" # change if you want
np.random.seed(42)
random.seed(42)
# -------------------------
# Helpers
# -------------------------
def random_dates(n, start="2023-01-01", end="2025-12-31"):
start_date = datetime.strptime(start, "%Y-%m-%d")
end_date = datetime.strptime(end, "%Y-%m-%d")
delta = (end_date - start_date).days
return [start_date + timedelta(days=random.randint(0, delta)) for _ in range(n)]
facilities = ["North Hospital", "South Clinic", "West Medical", "Downtown Health"]
departments = ["ED", "Primary Care", "Cardiology", "Radiology", "Ortho"]
providers = [f"Dr {i}" for i in range(1, 41)]
payers = ["Medicare", "Medicaid", "Aetna", "BlueCross", "United", "Self-Pay"]
# =====================================================
# 1. ENCOUNTERS (visits)
# =====================================================
dates = random_dates(N_ENCOUNTERS)
wait_times = np.random.gamma(2, 15, N_ENCOUNTERS).astype(int) # realistic skew
los = np.random.gamma(1.8, 2.2, N_ENCOUNTERS).round(1)
readmit = np.random.choice([0, 1], N_ENCOUNTERS, p=[0.9, 0.1])
encounters = pd.DataFrame({
"EncounterID": range(1, N_ENCOUNTERS + 1),
"Date": dates,
"Facility": np.random.choice(facilities, N_ENCOUNTERS),
"Department": np.random.choice(departments, N_ENCOUNTERS),
"Provider": np.random.choice(providers, N_ENCOUNTERS),
"PatientID": np.random.randint(10000, 99999, N_ENCOUNTERS),
"WaitTimeMinutes": wait_times,
"LengthOfStayDays": los,
"Readmitted": readmit
})
encounters.to_csv(OUTPUT_FOLDER + "encounters.csv", index=False)
# =====================================================
# 2. APPOINTMENTS
# =====================================================
status_probs = [0.75, 0.15, 0.10]
status_vals = ["Completed", "No-Show", "Cancelled"]
appointments = pd.DataFrame({
"AppointmentID": range(1, N_APPOINTMENTS + 1),
"Date": random_dates(N_APPOINTMENTS),
"Facility": np.random.choice(facilities, N_APPOINTMENTS),
"Provider": np.random.choice(providers, N_APPOINTMENTS),
"Status": np.random.choice(status_vals, N_APPOINTMENTS, p=status_probs)
})
appointments.to_csv(OUTPUT_FOLDER + "appointments.csv", index=False)
# =====================================================
# 3. CLAIMS (billing)
# =====================================================
billed = np.random.uniform(200, 5000, N_CLAIMS).round(2)
denied = np.random.choice([0, 1], N_CLAIMS, p=[0.85, 0.15])
paid = np.where(denied == 1, 0, billed * np.random.uniform(0.6, 1.0, N_CLAIMS))
claims = pd.DataFrame({
"ClaimID": range(1, N_CLAIMS + 1),
"Date": random_dates(N_CLAIMS),
"Payer": np.random.choice(payers, N_CLAIMS),
"BilledAmount": billed,
"PaidAmount": paid.round(2),
"Denied": denied
})
claims.to_csv(OUTPUT_FOLDER + "claims.csv", index=False)
# =====================================================
# 4. DATE DIMENSION
# =====================================================
start_date = datetime(2023, 1, 1)
end_date = datetime(2025, 12, 31)
dates = pd.date_range(start_date, end_date)
date_dim = pd.DataFrame({
"Date": dates,
"Year": dates.year,
"Month": dates.month,
"MonthName": dates.strftime("%b"),
"Quarter": dates.quarter,
"YearMonth": dates.strftime("%Y-%m")
})
date_dim.to_csv(OUTPUT_FOLDER + "date_dim.csv", index=False)
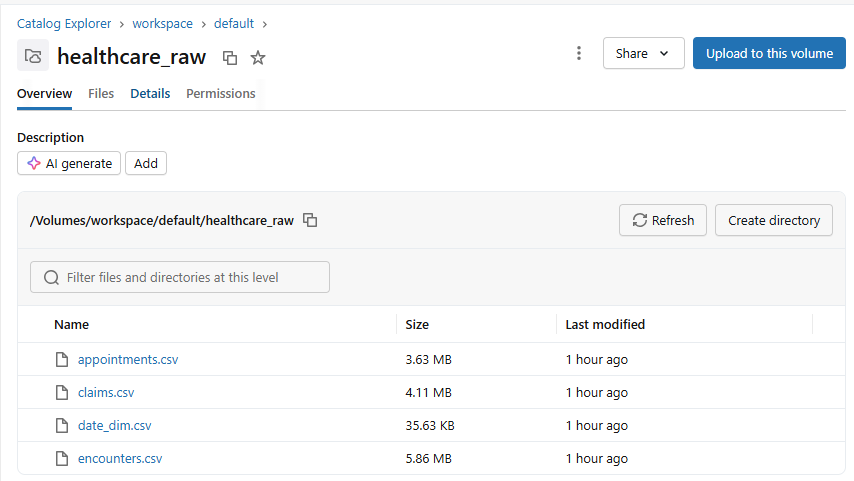
print("✅ Files created:")
print(" - encounters.csv")
print(" - appointments.csv")
print(" - claims.csv")
print(" - date_dim.csv")